torch.utils.tensorboard
Before going further, more details on TensorBoard can be found at https://www.tensorflow.org/tensorboard/
Once you’ve installed TensorBoard, these utilities let you log PyTorch models and metrics into a directory for visualization within the TensorBoard UI. Scalars, images, histograms, graphs, and embedding visualizations are all supported for PyTorch models and tensors as well as Caffe2 nets and blobs.
The SummaryWriter class is your main entry to log data for consumption and visualization by TensorBoard. For example:
import torch
import torchvision
from torch.utils.tensorboard import SummaryWriter
from torchvision import datasets, transforms

# Writer will output to ./runs/ directory by default
writer = SummaryWriter()

transform = transforms.Compose([transforms.ToTensor(), transforms.Normalize((0.5,), (0.5,))])
trainset = datasets.MNIST('mnist_train', train=True, download=True, transform=transform)
trainloader = torch.utils.data.DataLoader(trainset, batch_size=64, shuffle=True)
model = torchvision.models.resnet50(False)
# Have ResNet model take in grayscale rather than RGB
model.conv1 = torch.nn.Conv2d(1, 64, kernel_size=7, stride=2, padding=3, bias=False)
images, labels = next(iter(trainloader))

grid = torchvision.utils.make_grid(images)
writer.add_image('images', grid, 0)
writer.add_graph(model, images)
writer.close()
This can then be visualized with TensorBoard, which should be installable and runnable with:
pip install tensorboard
tensorboard --logdir=runs
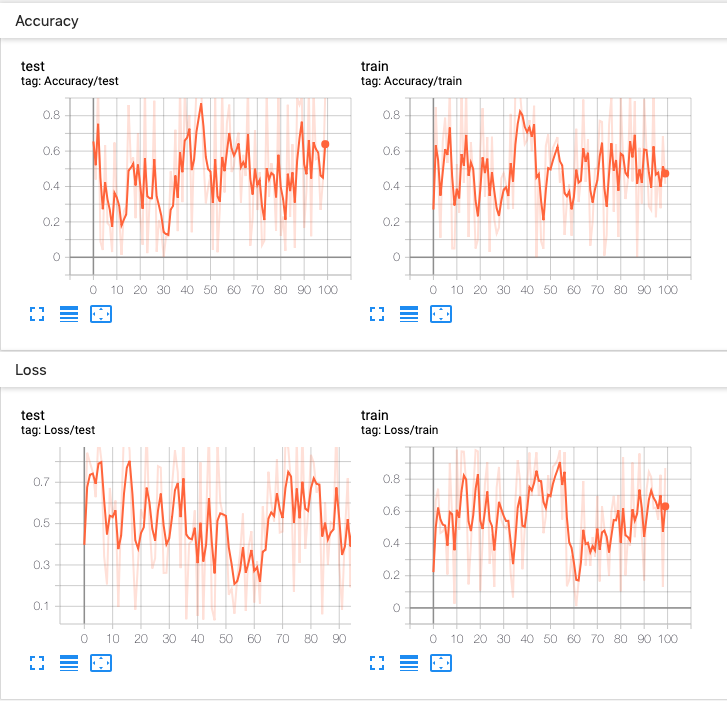
Lots of information can be logged for one experiment. To avoid cluttering the UI and have better result clustering, we can group plots by naming them hierarchically. For example, “Loss/train” and “Loss/test” will be grouped together, while “Accuracy/train” and “Accuracy/test” will be grouped separately in the TensorBoard interface.
from torch.utils.tensorboard import SummaryWriter
import numpy as np

writer = SummaryWriter()

for n_iter in range(100):
    writer.add_scalar('Loss/train', np.random.random(), n_iter)
    writer.add_scalar('Loss/test', np.random.random(), n_iter)
    writer.add_scalar('Accuracy/train', np.random.random(), n_iter)
    writer.add_scalar('Accuracy/test', np.random.random(), n_iter)
Expected result: